We track whether you show up when someone searches for what you sell, on Google and inside AI answers, and whether the site is technically sound enough to hold the ranking.
Position + clicks on your money termsMonthly
Am I showing up when someone searches for what I sell?
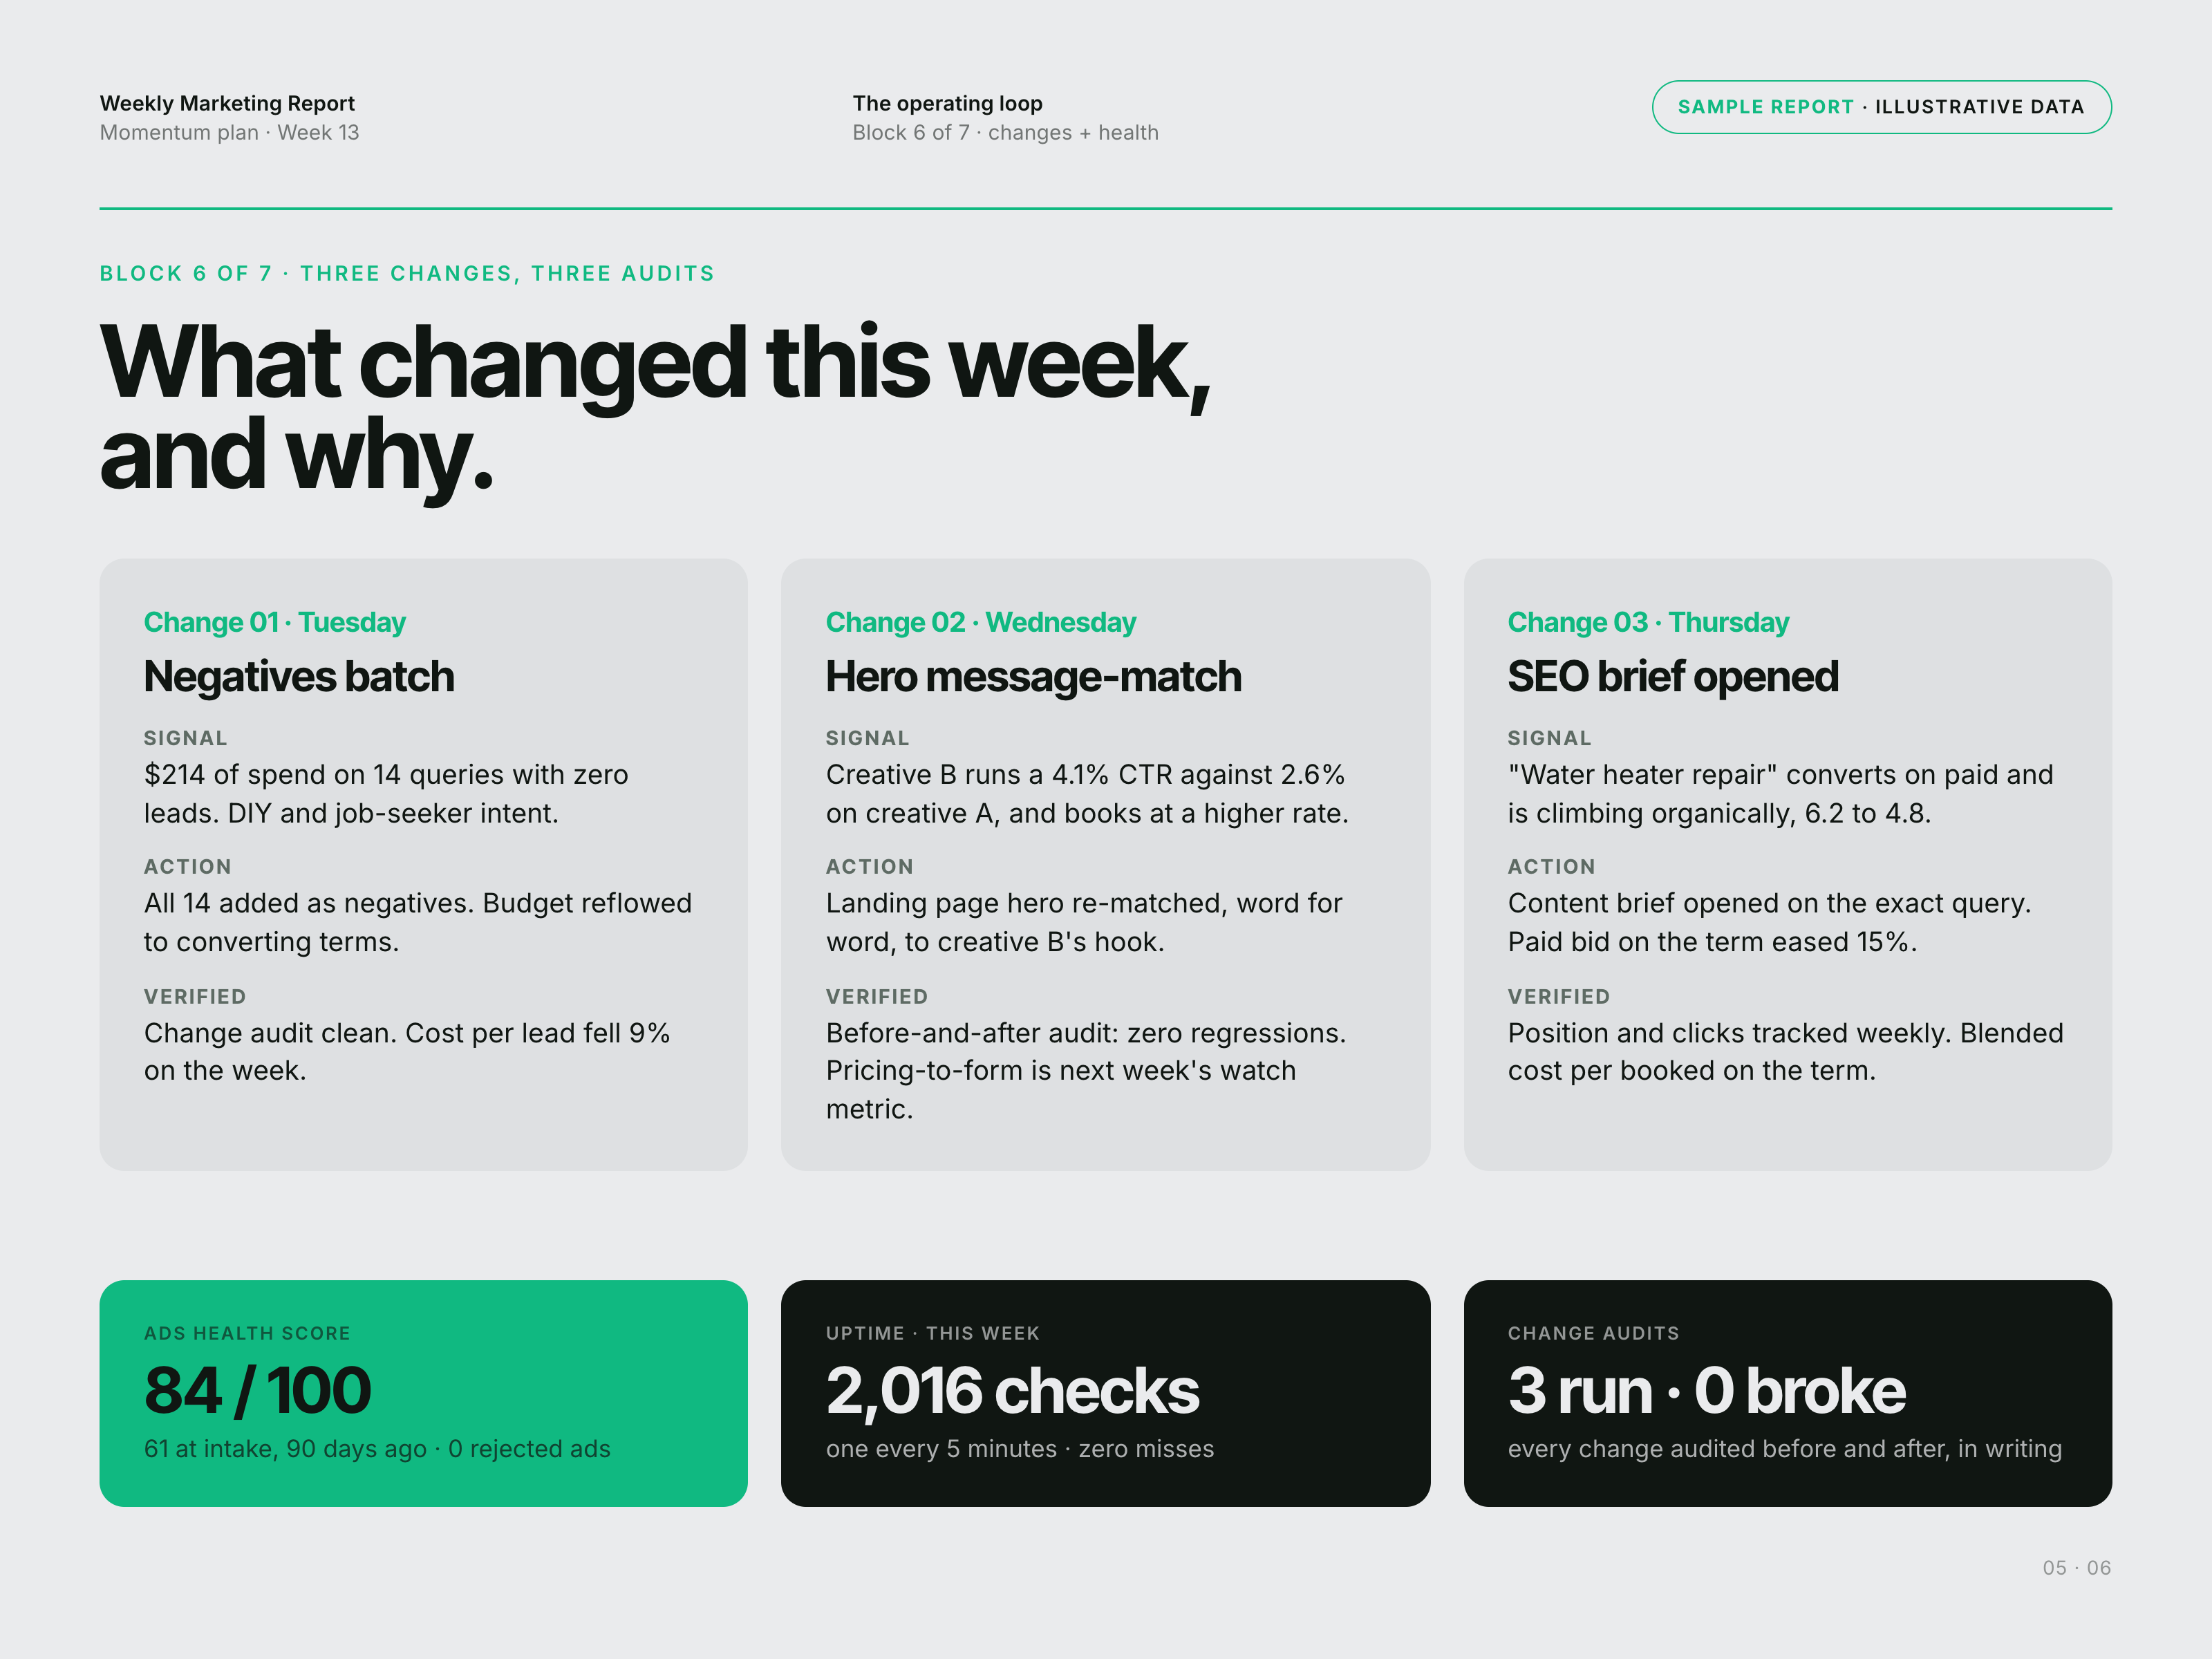
Monthly→What it changes: A term converting on paid becomes the next SEO brief.
Verified by: Position tracked on the exact term
Local pack presenceMonthly
Do I appear in the map results in my service area?
Monthly→What it changes: Points the citation and review work at the gaps.
Verified by: Pack presence next month
Core Web Vitals (technical health)Monthly + on change
Is my site fast and sound enough for Google to rank it?
Monthly + on change→What it changes: A slipping score opens a technical fix before rankings follow it down.
Verified by: Re-measured after the fix ships
Indexed pages vs. publishedMonthly
Is the work we shipped actually live in search?
Monthly→What it changes: Anything unindexed gets a crawl or sitemap fix that week.
Verified by: Index status re-checked
We measure what each kind of post does, then keep what works and kill what doesn't, in writing, every month.
Engagement by content pillarMonthly
Which kind of post is actually landing?
Monthly→What it changes: The pillar that lands gets doubled; the weak one gets cut.
Verified by: Winner/killer log next month
Reach per pillarMonthly
How many of the right people did the content reach?
Monthly→What it changes: Re-times and re-formats posts toward what reaches buyers.
Verified by: Reach trend
Winner / killer logMonthly
What's working, and what did we kill?
Monthly→What it changes: Next month's calendar is built from the winners.
Verified by: In writing, every month
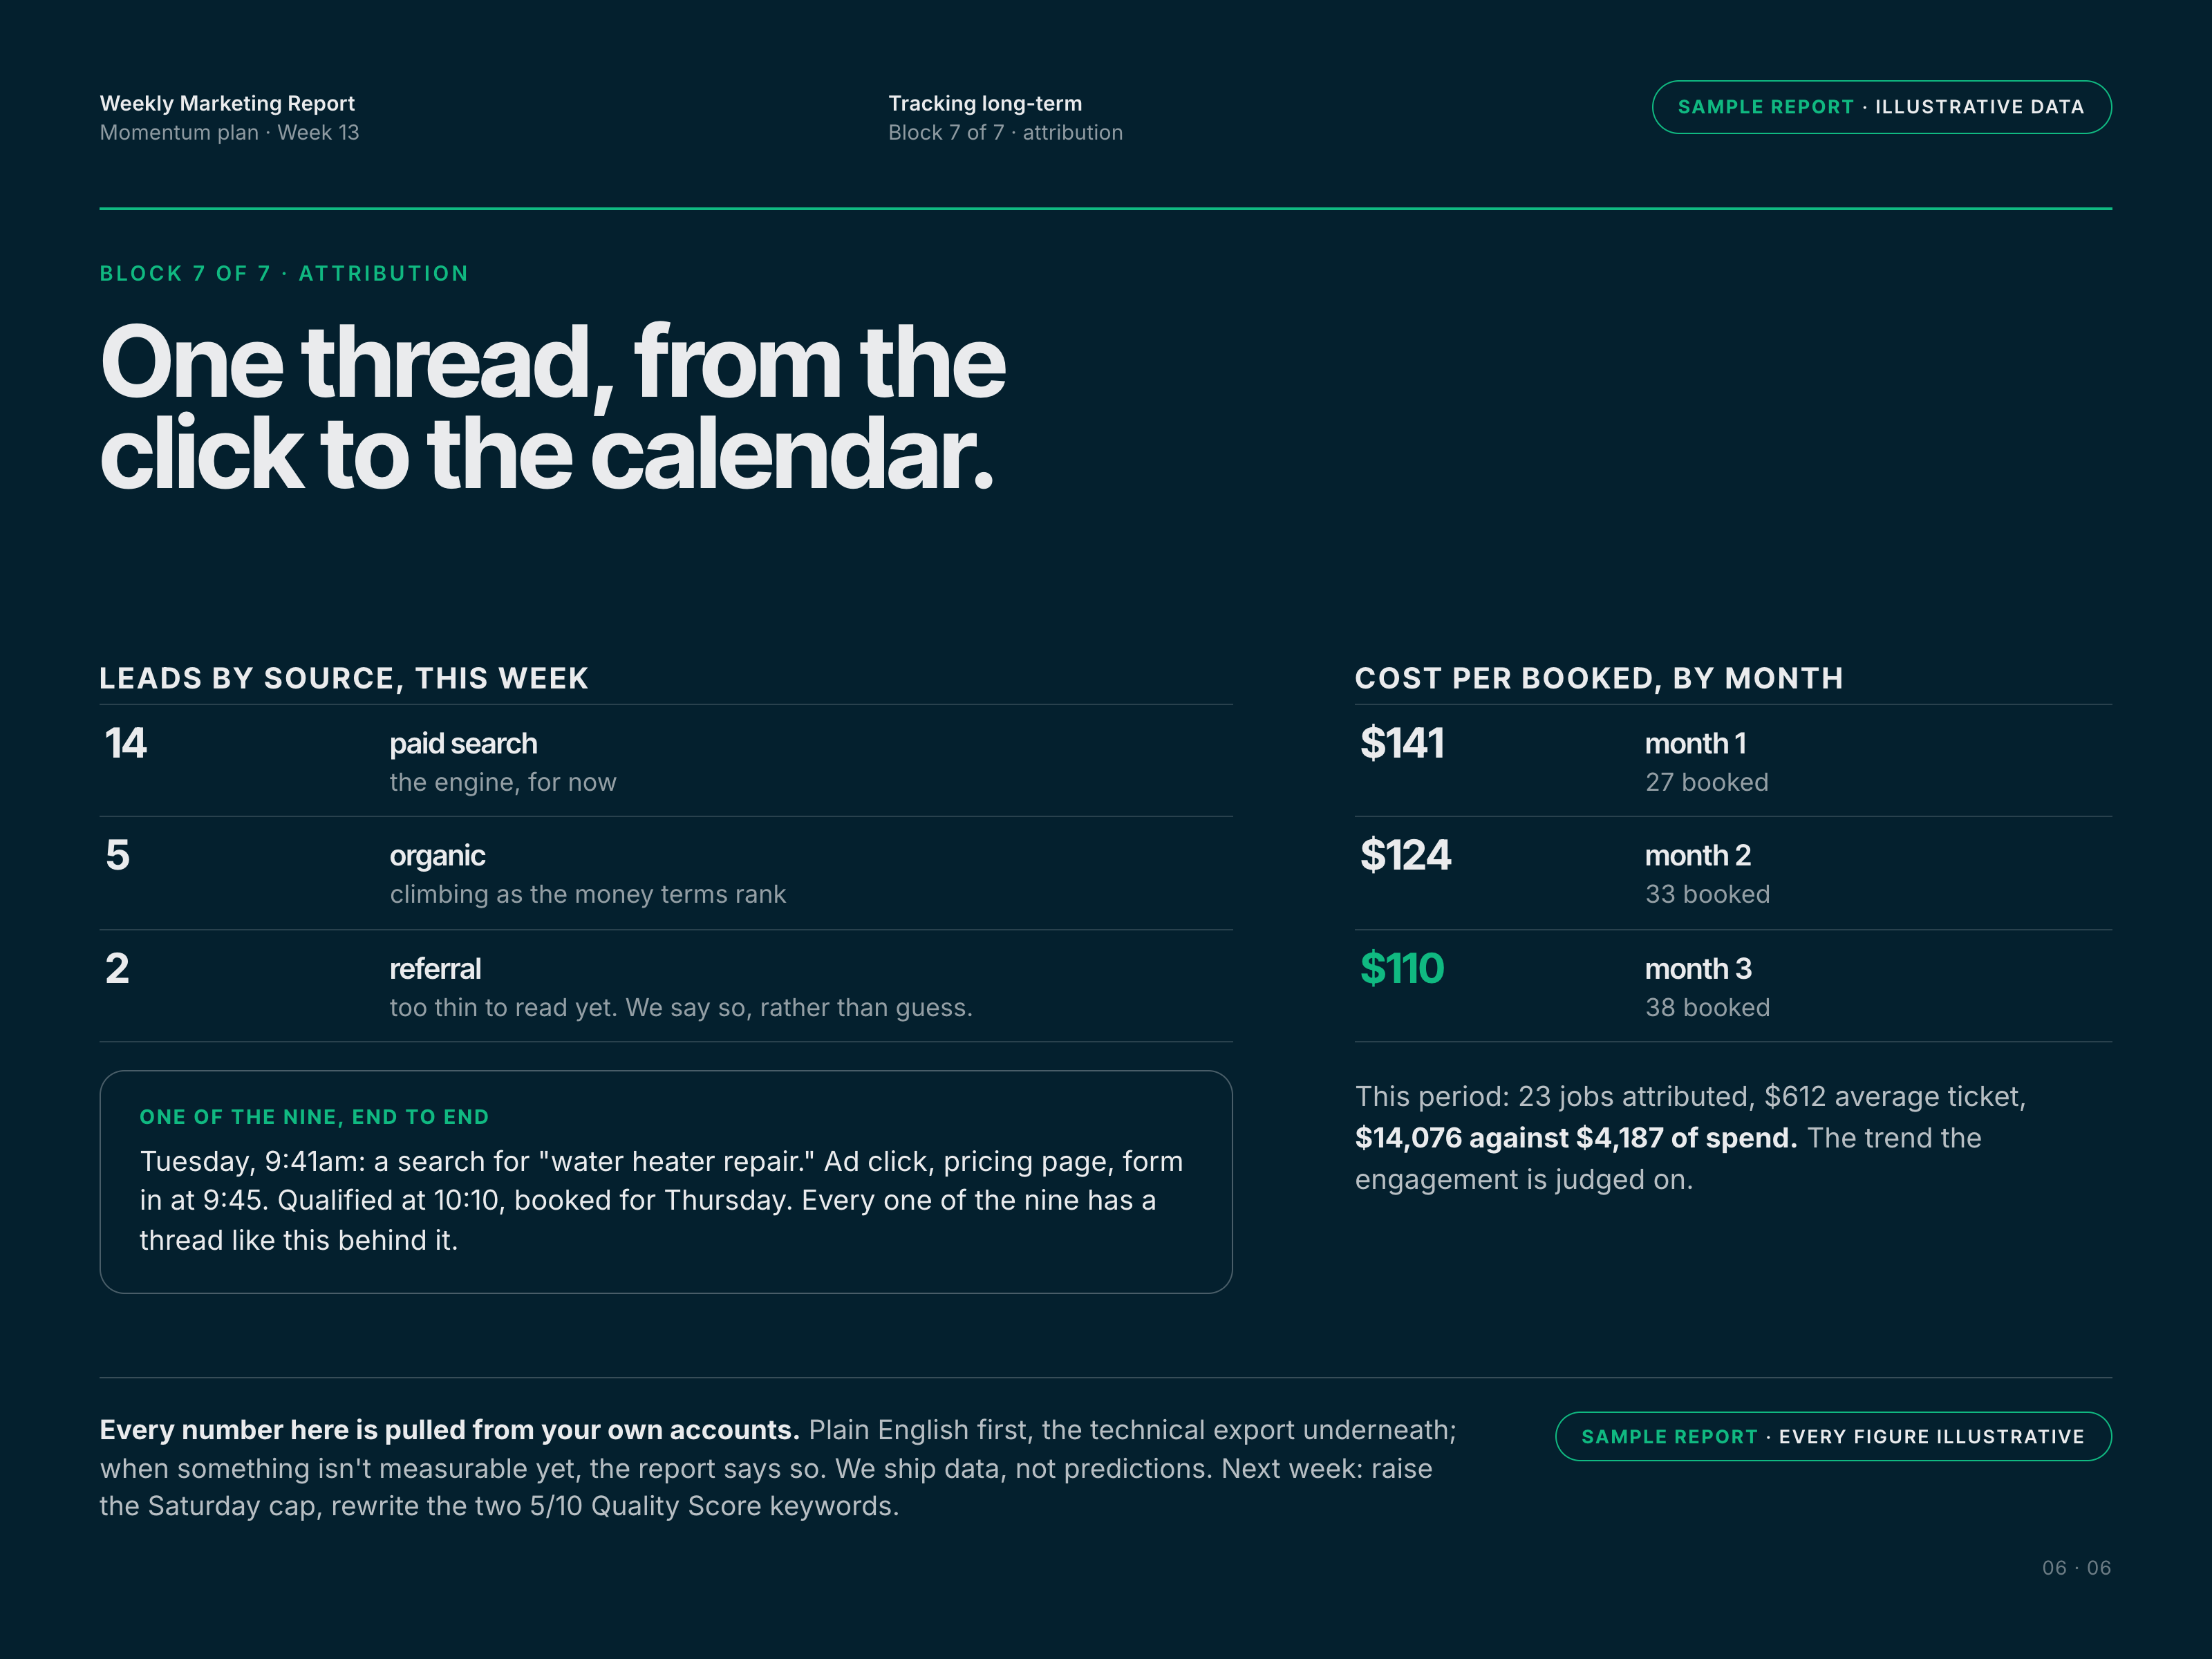
We follow one thread from the ad click to the qualified lead and tell you which channel actually produced it. (Add the AI front desk, and we can follow that same thread all the way to the calendar. See Infrastructure.)
Source-to-lead threadMonthly
Which channel actually produced the qualified lead?
Monthly→What it changes: Budget shifts to the channel that produces leads, not clicks.
Verified by: Next month's channel table
First channel vs. closing channelMonthly
What got them looking, and what got them to act?
Monthly→What it changes: The channel that finds them gets the awareness budget; the one that closes them gets the rest.
Verified by: The channel table in next month's report
Qualified leads, by channelMonthly
Where is my next customer actually coming from?
Monthly→What it changes: The next dollar goes where the last lead came from.
Verified by: Channel trend